Rüchardt Experiment for measuring γ=cp/cv

Experiments:
Study of an adiabatic transformation
Measurement of the ratio cp/cv for air
Software can run in virtual mode
Items supplied:
- Flask
- Piston
- Temperature sensor
- Position sensor
- Pressure sensor
- Metallic rings
- Ping-pong balls
- Splittable aluminum bar
- Table clamp for aluminum bar
- Double clamp 90°
- DataLogger
- Software for data collection
This method exploits the properties of adiabatic transformations of an ideal gas following the PVγ = const equation where the coefficient γ is equal to the ratio cp/cv In the original version of the experiment were carried out a series of compressions and expansions reversible adiabatic air mass, by swinging a ball into a thin glass rod connected to a flask, and measuring only the frequency of oscillation of the sphere.
The use of the technique allows to enrich the RTL experiment allowing an inspection of the nature of the transformations carried out in gas, by monitoring the progress of all three thermodynamic variables P, V, T.
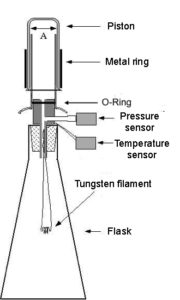
The apparatus consists of a flask is connected to an external oscillating piston of section A (Figure 1).
Volume trends over time is measured using a Sonarlocated above the oscillating piston, while a pressure sensor is connected to the volume of air in the flask.
By moving the piston of x amount from the equilibrium position, the corresponding change in volume is dV = xA and the corresponding force acting on the piston is
F = AdP =-A2 x γ P/V.
This is the equation of an harmonic motion
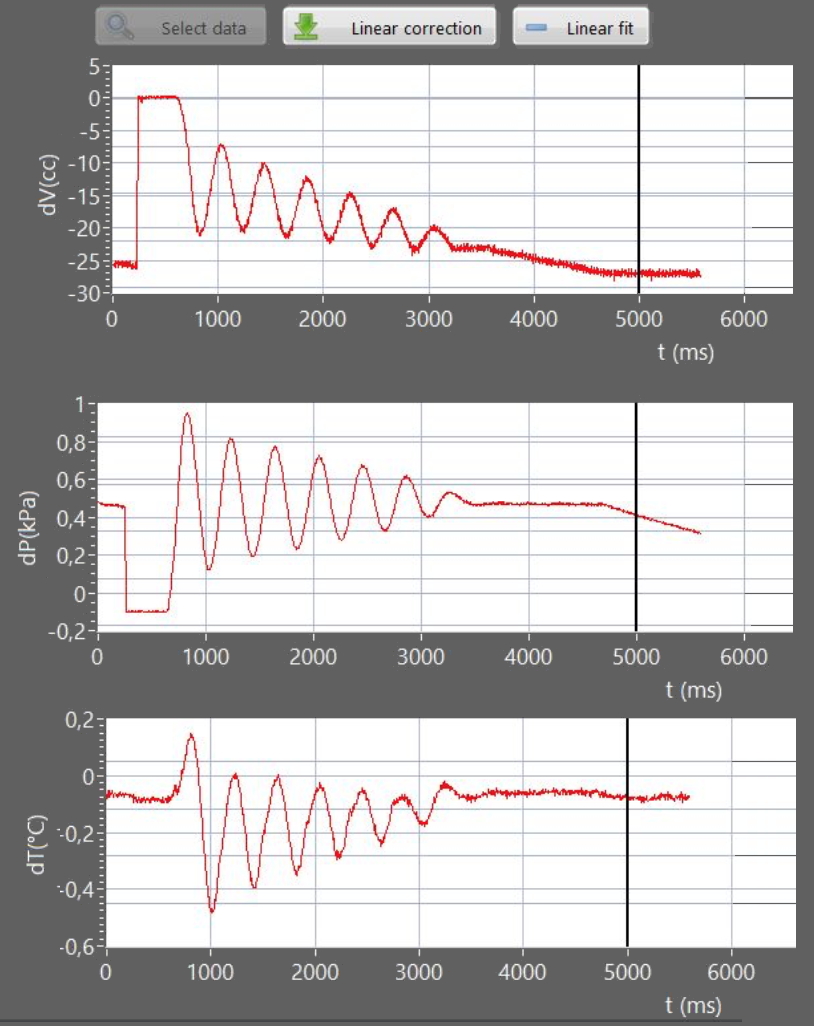
In Figure 2 shows an example of trends over time in pressure and temperature of the gas piston displacement (volume) obtained with 3 sensors.
The oscillations of the piston are almost harmonics .
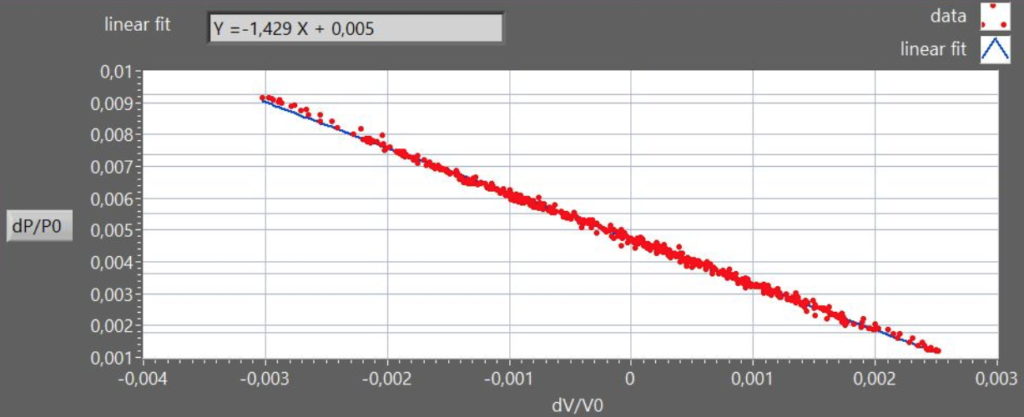
For small changes in pressure dP and dV the Poisson relation in differential form is
dP =-(γP/V) dV
A graph of dP/P0 versus dV/V0, is a straight line with slope -γ (Figure 3).
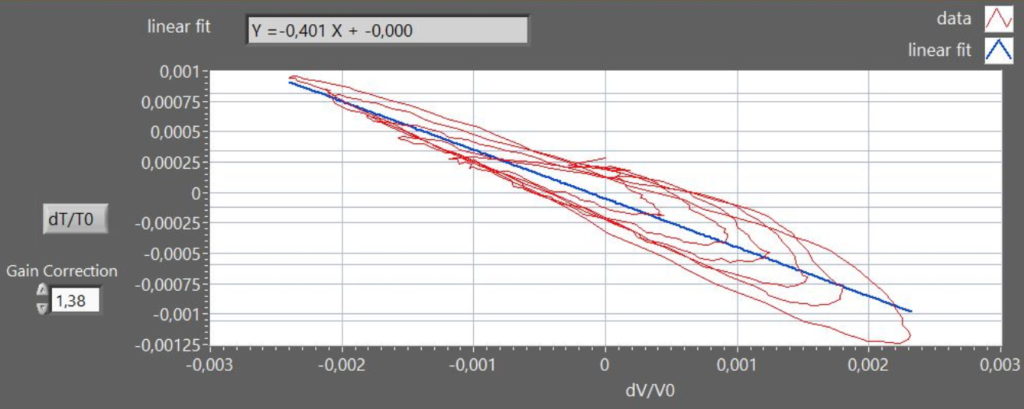
By substituting P=nRT/V into the Poisson equation we get the relation TV(γ-1) = const, from which :
dT/T= (γ-1) dV/V
which allows to evaluate γ from a plot of dT/T vs. dV/V
In figure 4, the graph shows a Lissajous curve approximating an elliptical spiral due to the time-lag in the thermometer response. Moreover, in figure 4 the nominal thermometer output was corrected by a factor 1.38, to obtain the expected slope value (-0.4), accounting for the attenuation of the signal due to the intrinsic low-pass filter provided by the thermometer finite heat-capacity.
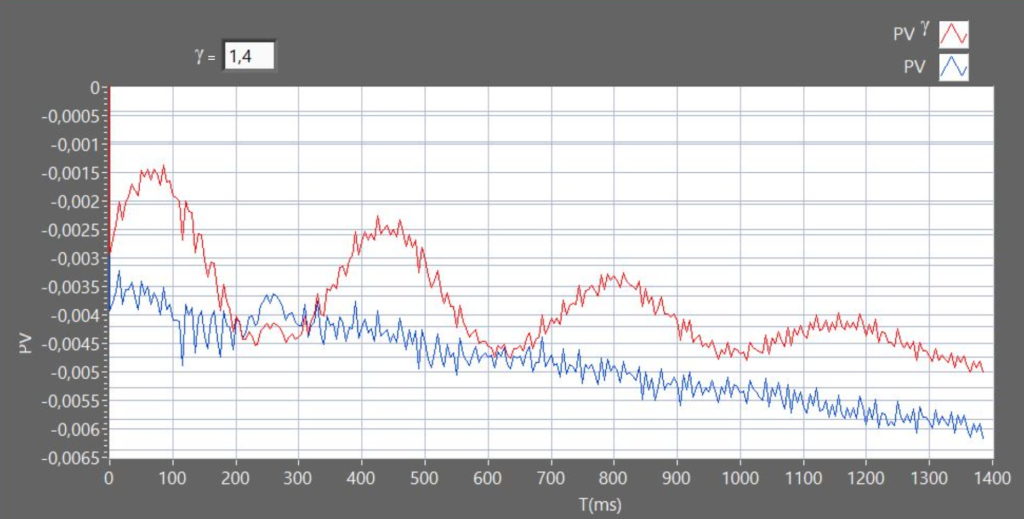
The nature of transformation from the gas can be checked by comparing trends over time of relative variations of the PV product (constant for an isotherm) and PVγ (constant for an adiabatic). (see Figure 5)
The dynamics can be modulated by changing the oscillating weight m (loading the piston with metal rings) or the effective air volume V (introducing ping-pong balls in the flask).
see: A new MBLversion of the Rüchardt experiment, Am. J. Phys. 69, (2001)
Complete analysis of data acquired can be performed by using the software provided. Software also runs in “virtual mode”. Students can do data analysis using data acquired in the lab.Datalogger connection is not required, you can make the same operations in virtual mode. The data can be exported in csv format and used with the main spreadsheets(Microsoft Excel™, Google Sheets™, Open Office™).