Diffraction and
Polarization

A
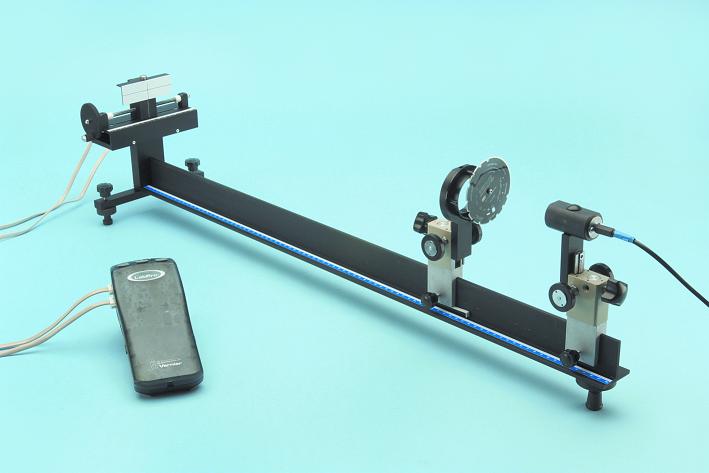
laser beam is directed onto a revolving base where slits, holes
and other openings are made. The resulting diffraction patterns
are received by a light sensor, which is linked to the linear
position sensor. If we move horizontally the sensor we obtain a
voltage proportional to the light intensity associated to the
sensor position. If we connect the outputs of the two sensors to
a data acquisition system we will then obtain, in real time, the
curves that indicate how light intensity varies according to the
position. As we know the geometrical characteristics of the
slits and their distance from the light sensor, we will also be
able to quantitatively assess these phenomena.
- diffraction phenomena;
- interference phenomena ;
- polarization phenomena;
- verification of Malus's law.
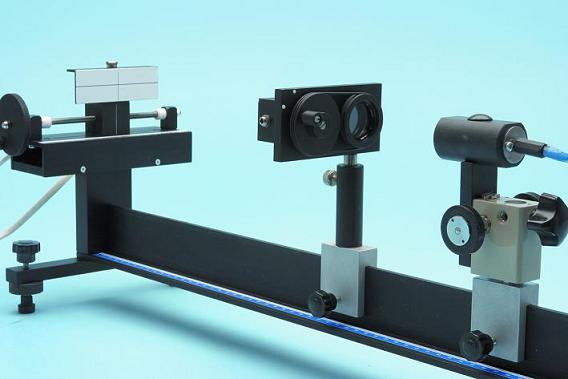
Optical bench to study phenomena of polarization
The
optical bench can also be fitted with a pair of aligned linear
polarizers to be assembled on the apposite base. One of these
polarizers can be manually rotated by means of a handle and is
also connected to an angular position sensor.
This allows us to obtain a curve indicating the luminous intensity of light produced in relation to the angle formed by the two polarizers.
This allows us to obtain a curve indicating the luminous intensity of light produced in relation to the angle formed by the two polarizers.
Material supplied as standard:
- optical bench
- light sensor
- linear position sensor
- high-quality diode laser
- power supply unit for laser diode with variable intensity
- supports
- screens
- 2 sets of revolver slits
- cables
- angular position sensor
- 2 linear polarizers
The graph of figure 1 was obtained by pointing the laser
beam at a slit with a width a
= 0.04 mm located at a distance L = 700 mm from the
sensor.
As we know that the laser wavelength is λ=635 nm, we will be able to assess the relation that provides the distances of minimums from the central point
As we know that the laser wavelength is λ=635 nm, we will be able to assess the relation that provides the distances of minimums from the central point
X
m=Lnλ / a for n =
1,2,3,...
Moreover we can, for instance, measure the ratio between the
intensity of the first secondary maximum and that of the central
maximum.
The graph of figure 2 was drawn by pointing the laser beam at a double slit. It clearly shows the superposition of two undulatory phenomena: the interference according to Young produced by the two slits and the diffraction generated by every single slit.
The graph of figure 2 was drawn by pointing the laser beam at a double slit. It clearly shows the superposition of two undulatory phenomena: the interference according to Young produced by the two slits and the diffraction generated by every single slit.

Figure1
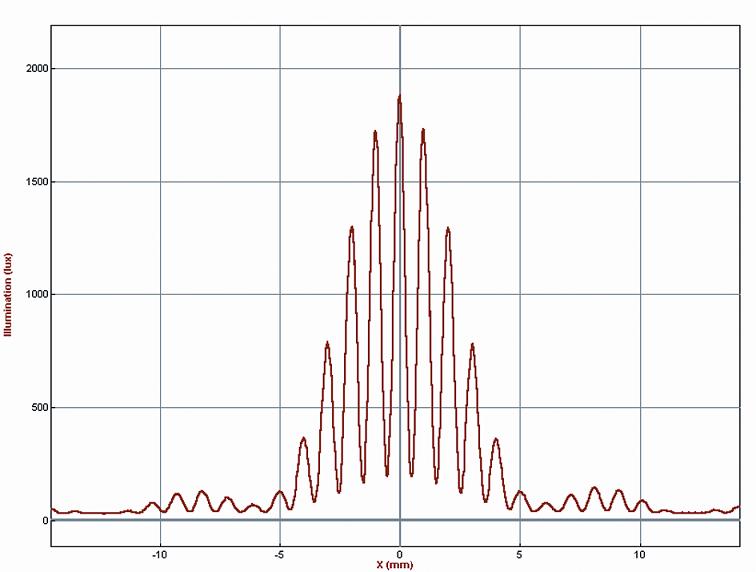
Figure2
Didactical material:
- Student guide to experiments
- Teacher manual