
(w= angular frequency, T= period)


(w= angular frequency, T= period)

The small amplitude oscillation
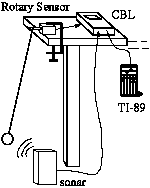
may be studied using data taken with sonar.
The plots x(t), v(t), a(t)
appear sinusoidal. Measurements of the period T vs. amplitude a
indicate
that the motion is isochronous. It may be shown that T does not depend
on the value of the mass while it does depend on its distance L from the
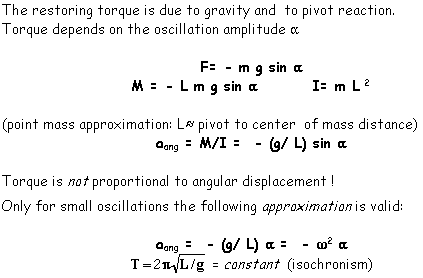
center of oscillation.The value predicted by the model (T=2p*L/g)
can be compared with the one measured from the plots
x(t), v(t), a(t).

The large amplitude oscillation may be studied using data taken with the potentiometric sensor (after converting voltages into angles a.
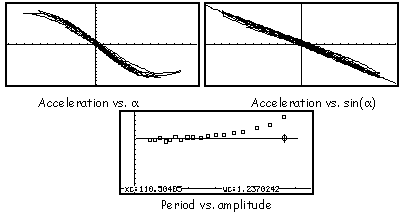
Here the distortion of the plots of vang(t) and of aang(t) with respect to damped sinusoidal funtions is clearly evident. Also the plot of aang vs. a is no more linear.
Instead aang is linear with sina (as predicted by the model aang = óg/Lsina.

Also a plot of the period T vs. a will show that the pendulum is far from being isochronous.